简单搭建监控系统
基础环境:
下载监控系统部署模版另存为k2-compose.yml,或者直接下载演示项目git clone https://github.com/Tsui89/docker-presentation.git
version: "2"

hosts:
#  as: 10.1.10.48:4243
  as: unix:///var/run/docker.sock

project: demo

services:
  grafana:
    image: dev.k2data.com.cn:5001/demo/grafana:master-0.0.1
    health_check:
      http: http://localhost:3000
      timeout: 10
    ports:
      - 3000:3000
    s_depends_on:
      - influxdb

  influxdb:
    image: dev.k2data.com.cn:5001/demo/influxdb:master-0.0.1
    host: as
    environment:
      - INFLUXDB_OPENTSDB_ENABLED=true
    health_check:
      socket:  localhost:8086
      timeout: 10
    volumes:
      - ./db:/var/lib/influxdb
    ports:
      - 8086:8086
      - 4242:4242
部署监控系统
- 部署、配置influxdb
# Tsui @ Capitan in ~/git-resource/docker-presentation on git:master x [21:45:37]
$ k2-compose up -d
Creating demo_influxdb_1 ...
Creating demo_influxdb_1 ... done
Creating demo_grafana_1 ...
Creating demo_grafana_1 ... done

# Tsui @ Capitan in ~/git-resource/docker-presentation on git:master x [21:45:47]
$ k2-compose bash influxdb
#####In [influxdb] Container#####
root@3701870f3a68:/# influx
Connected to http://localhost:8086 version 1.2.0
InfluxDB shell version: 1.2.0
> auth demo demo
> create database opentsdb
> exit
root@3701870f3a68:/# exit
exit
#####Out [influxdb] Container#####
- 配置grafana
登陆localhost:3000,用户名密码 admin/admin
首先添加data source如下图:

一些配置如下图,数据库连接用户名/密码是demo/demo

- 将刚才部署的集群的信息展示在grafana上
首先利用k2-compose发送数据、创建dashboard.json,如当前环境的demo.demo-dashboard.json
# Tsui @ Capitan in ~/git-resource/docker-presentation on git:master x [22:02:15]
$ k2-compose agent --prefix demo --interval 3 --opentsdb-http localhost:4242
send success [{'timestamp': 1503151397, 'metric': 'demo.demo.hosts', 'value': 3L, 'tags': {'host': 'default'}}, {'timestamp': 1503151397, 'metric': 'demo.demo.hosts', 'value': 3L, 'tags': {'host': 'as'}}, {'timestamp': 1503151397, 'metric': 'demo.demo.services', 'value': 3L, 'tags': {'service': 'influxdb'}}, {'timestamp': 1503151397, 'metric': 'demo.demo.containers.influxdb', 'value': 1L, 'tags': {'type': 'health_check'}}, {'timestamp': 1503151397, 'metric': 'demo.demo.containers.influxdb', 'value': 1999.06, 'tags': {'type': 'mem_limit'}}, {'timestamp': 1503151397, 'metric': 'demo.demo.containers.influxdb', 'value': 12.3, 'tags': {'type': 'mem_usage'}}, {'timestamp': 1503151397, 'metric': 'demo.demo.containers.influxdb', 'value': 0.62, 'tags': {'type': 'mem_utilization'}}, {'timestamp': 1503151397, 'metric': 'demo.demo.containers.influxdb', 'value': 0.07, 'tags': {'type': 'cpu_utilization'}}, {'timestamp': 1503151397, 'metric': 'demo.demo.services', 'value': 3L, 'tags': {'service': 'grafana'}}, {'timestamp': 1503151397, 'metric': 'demo.demo.containers.grafana', 'value': 13L, 'tags': {'type': 'health_check'}}, {'timestamp': 1503151397, 'metric': 'demo.demo.containers.grafana', 'value': 1999.06, 'tags': {'type': 'mem_limit'}}, {'timestamp': 1503151397, 'metric': 'demo.demo.containers.grafana', 'value': 13.22, 'tags': {'type': 'mem_usage'}}, {'timestamp': 1503151397, 'metric': 'demo.demo.containers.grafana', 'value': 0.66, 'tags': {'type': 'mem_utilization'}}, {'timestamp': 1503151397, 'metric': 'demo.demo.containers.grafana', 'value': 0.05, 'tags': {'type': 'cpu_utilization'}}]
# Tsui @ Capitan in ~/git-resource/docker-presentation on git:master x [22:03:48]
$ ls
db                       docs                     influxdb                 opentsdb_http_sender.py
demo.demo-dashboard.json grafana                  k2-compose.yml           random.sh
然后在granfana上选择dashbord import demo.demo-dashboard.json。

influxProd 选择我们刚创建的datasource名称
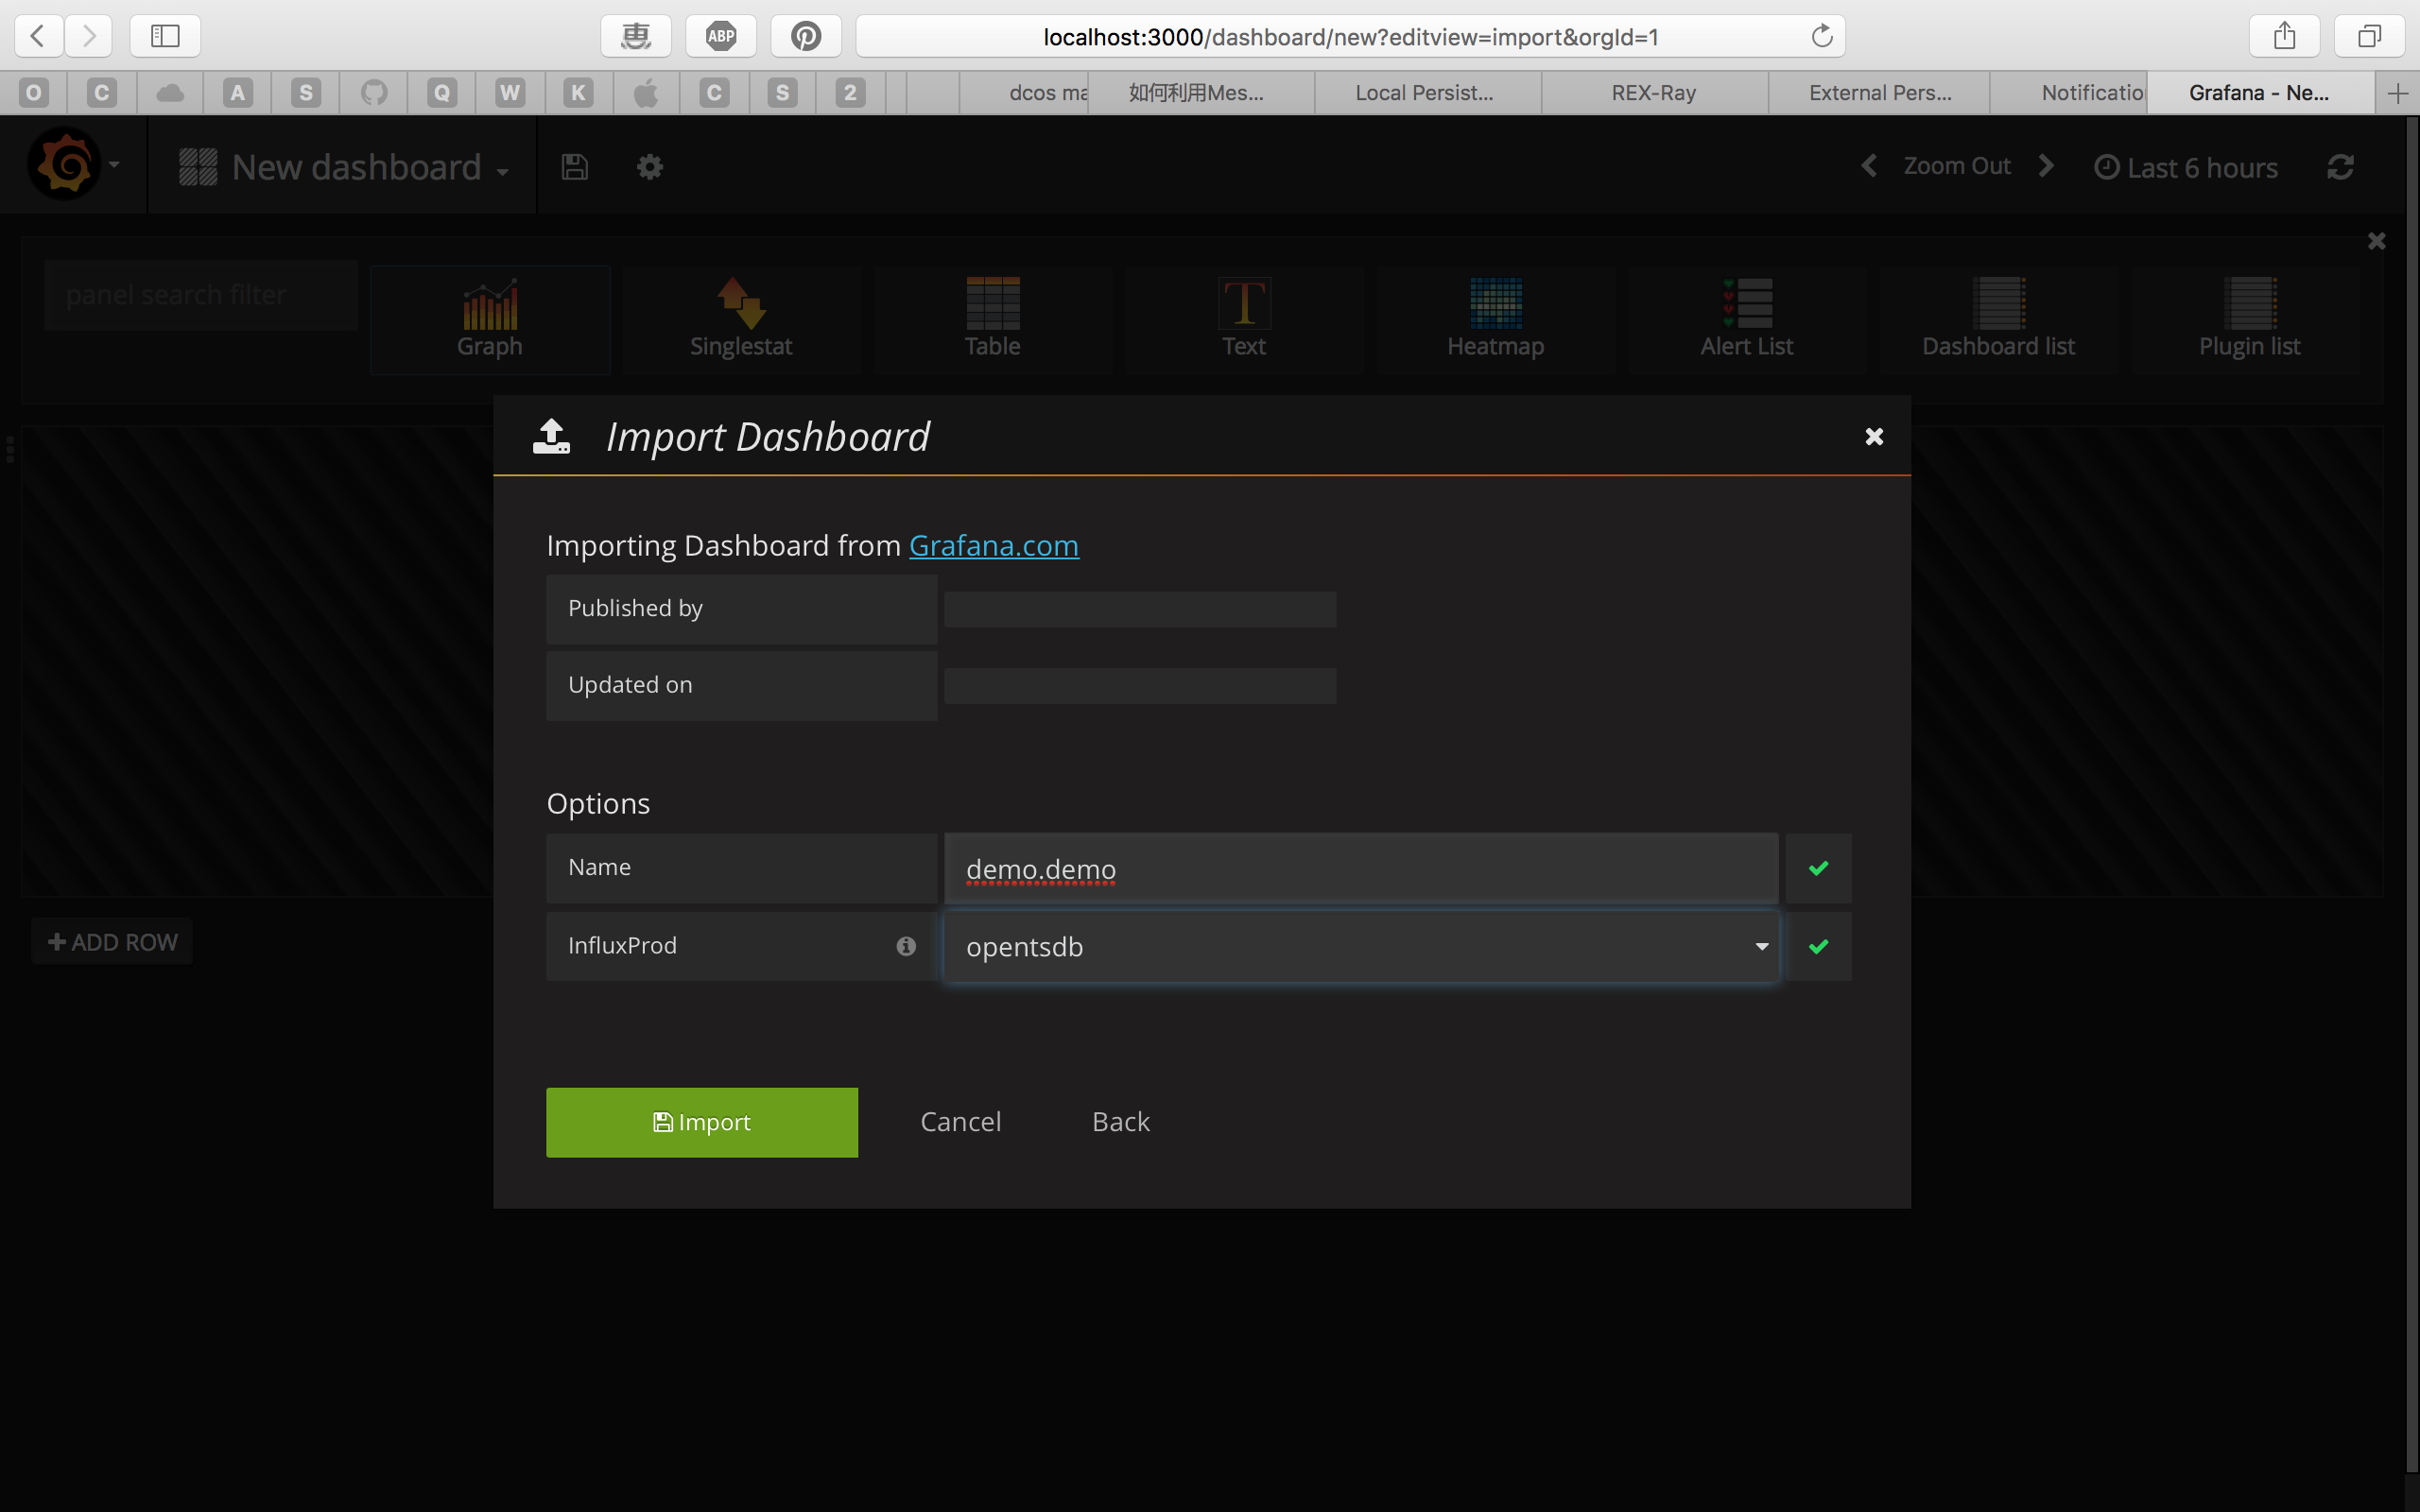
整个的集群监控如下图
